Introduction
The AURORA Demonstrator at University of Ljubljana has been installed and has been in operation for more than half a year. The AURORA Team at UL has performed an early performance analysis of the power plants over the summer of 2025. The results of the analysis were presented at the European Photovoltaic Conference (EU PVSEC 2025) in Bilbao, Spain.
Ljubljana Demo description
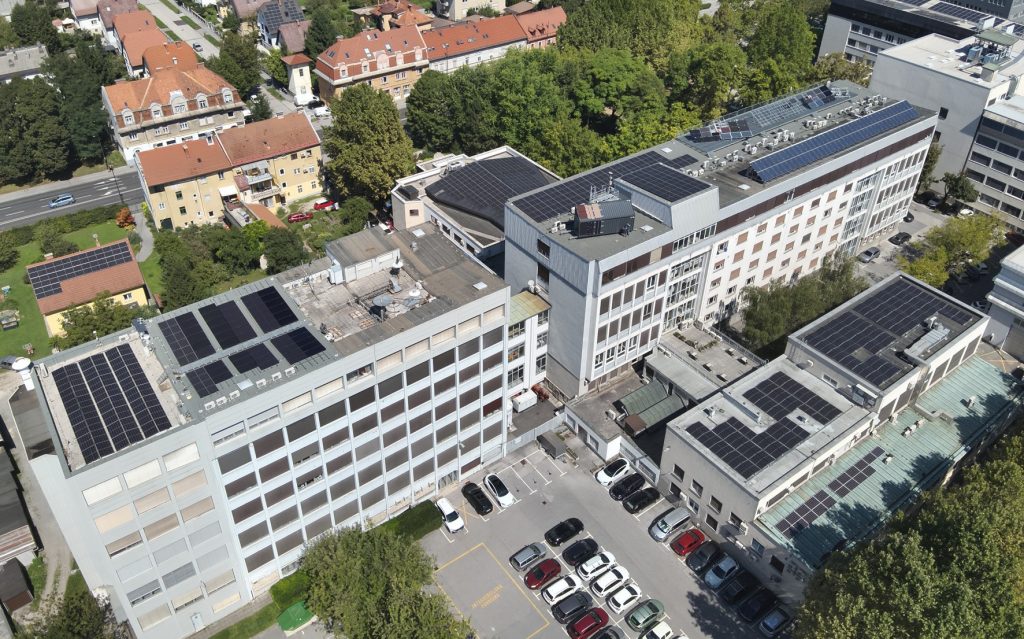
The AURORA demonstrator power plant in Ljubljana consists of five power plants on different roofs on the Faculty of Electrical Engineering. All power plants are based on the TOPCon glass-glass modules with different configurations of inverters, inverters with optimizers and microinverters. The exception is the field of research modules, where modules with different cell technologies are used with single module optimizers for comparison between different technologies (TOPCon, PERC, SHJ, and IBC). Added to the analysis is a 15 year old power plant with Al-BSF cells. The varied design of the power plants is an excellent opportunity for demonstration and analysis of different power plants and will be used for both, educational and research purposes at UL.
Methodology
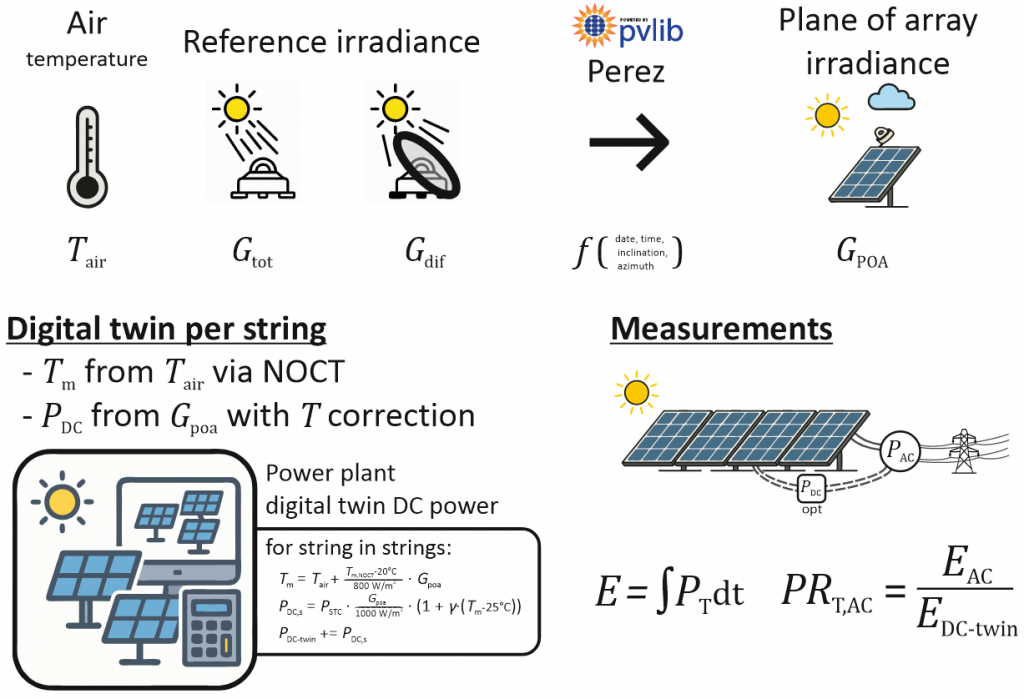
Energy production data during the summer (March to August) of 2025 were analysed with a digital twin approach. Global and diffuse irradiance data and and air temperature measurements were transformed to plane of array irradiance and module temperature using Python library pvlib. Each string with different properties was modelled individually. Final performance evaluation relied on temperature-corrected AC performance ratio and energy yield for PV power plants, and on DC performance ratio for PV modules. To model only the performance of PV modules and power electronics, periods when power plants were shaded were identified and then ignored from the dataset.
Results
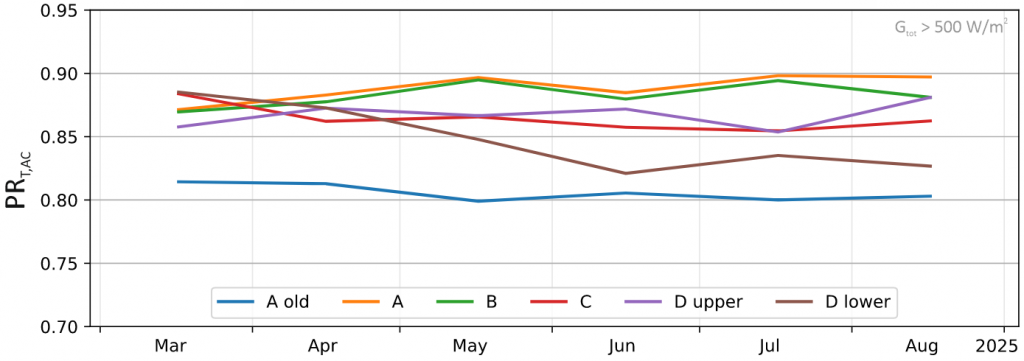
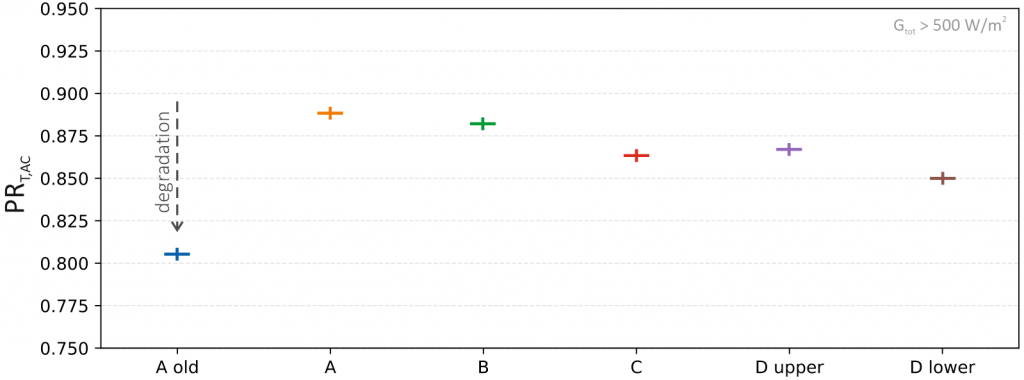
The new PV plants installed in the scope of AURORA project achieve shading and temperature corrected power ratio values between 0.85 and 0.9, while the old reference power plant show a 5-10% expected degradation. String inverters performed best under unshaded conditions, while power plants equipped with power optimizers perform about 1% lower, and microinverter systems show roughly 3% lower performance. A slight drop in June performance occurs across several low-tilt or flat roof systems, likely due to higher module temperatures caused by poor ventilation and roof insulation. Systems with steeper tilts and better ventilation maintain more stable performance throughout the year. During the first half of the year no systematic degradation was observed.
Conclusion
The AURORA Demonstration power plants operated as expected. During the analysed period they produced 170 MWh of electricity, which was self-consumed by the faculty and saved about 100 tons of CO2 Emissions. The detailed paper will be published at EU PVSEC 2025 proceedings at session number 4CV.1.7.
Figures
Power plants @UL
Digital Twin Model
Total temperature corrected performance ratio
Monthly performance without shading